Market Update 2019
The financial year ends on a positive despite ongoing concerns around the China/US trade war, weakening global growth and the Brexit saga.

The table below provides details of the movement in average investment returns from various asset classes for the period up to 30 June 2019.
| Asset class (% change) |
| 1 month | 3 months | 1 year | 3 years |
| Australian shares |
| 3.7 | 8.0 | 11.6 | 12.9 |
| Smaller companies |
| 0.9 | 3.8 | 1.9 | 10.7 |
| International shares (unhedged) |
| 5.3 | 5.2 | 12.0 | 14.0 |
| International shares (hedged) |
| 5.9 | 3.4 | 6.2 | 12.6 |
| Emerging markets (unhedged) |
| 4.9 | 1.8 | 6.6 | 12.9 |
| Property - Australian listed |
| 4.2 | 4.1 | 19.4 | 8.4 |
| Property - global listed |
| 0.5 | -0.1 | 7.7 | 4.2 |
| Australian fixed interest |
| 1.0 | 3.1 | 9.6 | 4.2 |
| International fixed interest |
| 1.3 | 2.7 | 7.2 | 3.1 |
| Australian cash |
| 0.1 | 0.5 | 2.0 | 1.9 |
Overview and outlook
The financial year ends on a positive despite ongoing concerns around the China/US trade war, weakening global growth and the Brexit saga. Globally, there continues to be a conflict between rising equity markets which suggest a positive earnings outlook while rising bond prices (falling yields) is suggestive of a negative economic growth outlook. In some ways they both could be correct just on different time frames. Bond markets may be simply reflecting the monetary response to slowing activity and equity markets may be reflecting the flow through effects of any monetary or fiscal policy likely in response to any significant slowing in conditions.
Real GDP and Consensus estimates
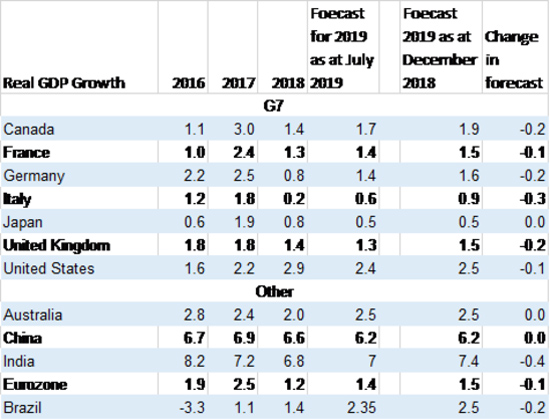
Source: FactSet, AMP
Consensus estimates as shown above may be an indicator of which market is likely to be correct. The table below clearly shows that economists are expecting economic growth to slow across the globe.
The median consensus estimate has been reduced for all but one G7 countries between December last year and now, and growth is also expected to slow in Brazil and India. For many countries this slowing is in addition to the actual slowdown already experienced in 2018.
June median house price % change
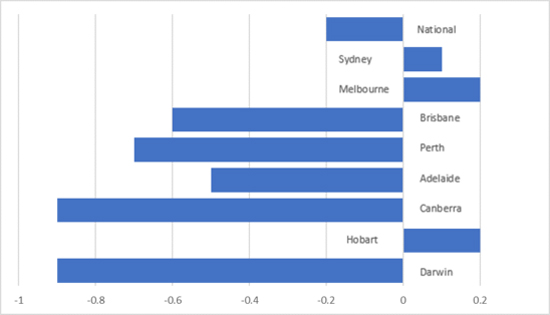
Source: ABC News, CoreLogic, AMP
Australia’s capital city house prices continued to fall in June, with a national decline of 0.2% however the results of the surprise victory of the Morrison Government in the May federal election could be seeing signs of the market bottoming out. With the policies of the ALP now no longer relevant to the property market, Melbourne’s house prices rose 0.2% and Sydney’s rose 0.1%. This was the first monthly gain in house prices in Sydney in nearly two years and for Melbourne in 19 months. With interest rates having now been cut to just 1.0%, relaxing of lending conditions by both regulators and lender and more conducive government policy, there is a chance that housing shifts from being a drag on economic activity to being neutral or potentially even a tail wind.
The outlook remains mixed with any slowdown likely to be met with action from either or both central banks and government. Caution is warranted as risks to growth continue to rise for most economies globally.
Share markets
Global share markets rose strongly in June with all major markets rising. With the stalemate in the UK over Brexit, meaning any negative impacts have been delayed for a period, and the potential for some positive outcomes at the Osaka G20 Summit at month end, investors in equity markets bid up prices. As mentioned above, expectation of monetary and potentially fiscal support for any slowdown likely also played a role in performance in June.
International shares gained 5.9% during the month on a currency hedged basis. This was supported by strength in US equities which gained over 7% and hit a new all-time high during the month. Emerging markets also performed reasonably well gaining nearly 5% during the month held back by India’s market decline of just over 1% being one of few markets to decline in June after India imposed a range of retaliatory tariffs on US products.
Australian shares gained 3.7% for the month, as investors moved past the outcome of the federal election. The market underperformed the global market likely due to the slowing domestic economic conditions and the weakness experienced in housing prices.
Material was the strongest performing sector in June (+6.4%), followed by Industrials (5.4%) and Healthcare (4.2%). The weakest sector was Consumer Discretionary (-1.5%) the only sector to lose ground in the month, Info Tech (1.0%), and Energy (2.1%).
With gold up nearly 8% in US dollar it is no surprise that gold stocks were the best performer with Northern Star (24.3%) Newcrest (19.5%) and last month’s top performer Evolution Mining (17.8%). This highlights the strange nature of the market bidding up defensive assets and growth assets at the same time. The worst performer was Link Administration (-36.0%) as it downgraded earnings on challenges in the UK followed be Challenger (-19.1%) who also flagged difficulties in its business with margin pressure and weaker sales and Whitehaven Coal (-12.9%) on the back of the continuing decline in coal prices.
Newcastle Coal near term
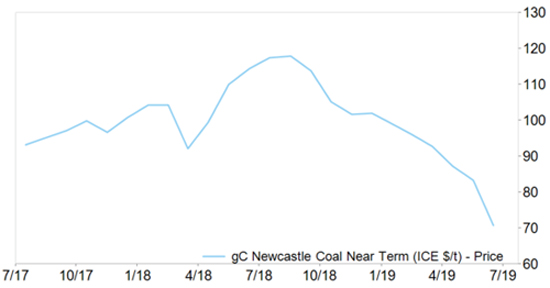
Source: FactSet, AMP US$/t
Interest rates
Bonds continued to rally despite growth assets also seeing strong positive returns in the period. Domestically the Australian 10-year yield fell to record lows of finishing at 1.32% down 16 basis points. This was driven by the first cut in policy rates by the RBA with expectations of more to come on the back of weakening economic conditions.
In the US, the 10-year yield fell 12bps to 2.01% as economic slowdown and weaker corporate earnings continue to be expected. As can be seen below, yields on bonds have not followed the rhetoric of recent years that they could only rise and being invested in bonds rather than cash has been very positive with global fixed interest gaining 7.2% over the last 12 months and 1.3% in June and domestic fixed interest gaining 9.6% over the year and 1.0% in June.
United States Treasury Yield Curve
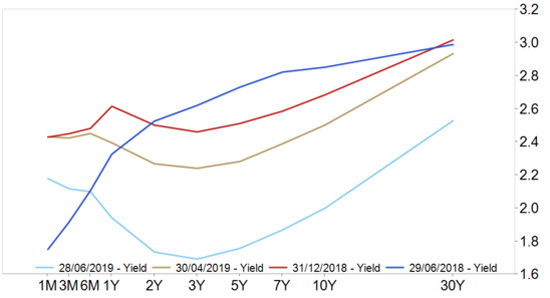
Source: FactSet, AMP
Property
Listed Property Markets also performed well although not as strong as global equities with Australian listed property (4.2%) outperforming the local equity market in a sign of seeking supposedly safer growth assets. Global Listed Property (0.5%) saw the reverse where broader equities performed significantly better as investors appeared less cautious. We continue to consider broad diversification across all these asset classes and avoiding expressing strident views in portfolios.
AMP
